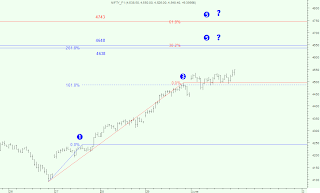
Yesterday I asserted, "but remember one thing, there wont be any clue of weakness above 4435 and crossing 4465/70 will just make it fly to our next targets"- and nifty did exact. And also talked about the 3rd wave characteristics. I also discussed about the failure bounce near 4465 while discussing the correctives and nifty gap up above that level and took support exactly at 4465 while retracing intra day. And it became successful retest of 4465 instead of failure bounce towards 4465. Before going into larger explanation and making it complicated, let me say once again that nifty is in super bullish mode. And our target of 4587-4647-4737 is live and kicking. For the session to come crossing 4585/90 will bring 4606 & 4640/48 level. where it may face some profit booking. But don't get confused if it really starts profit booking around 4640 level, because in that case 4585 & 4565 would big zone to buy into for the intra day. So not going into much words,

Supports: 4520-4465
Resistances: 4587, above 4587 I personally feel 4585-65 would act as support. Next 4606-4640/48-4695-4737/43.
Dips should be used to buy into.
(All future levels, 15 & 5 minutes chart attached respectively)
Happy trading all...comments are welcome.


Dear Sir,
ReplyDeleteI am regular visitor of your blog from last 3 weeks and found your analysis is suprb. I am novice in stock market and looking for guidance in understanding chart. It would be great if you provide some help.
Thanks in advance.
Regards,
Mukesh.
i am also need help in understanding chart. i am also regular visitor for your blog.your work is really great
ReplyDeleteHi Satyam,
ReplyDeleteNice analysis! Do you usually mark EW manually or using any software?
-Doji
Hi doji,
ReplyDeleteThanx for the comment! No I never use softwares to determine waves. actually my studies are based on the Fibonacci application on the price movement, and Elliot wave's most interesting and important feature is fiboannci relations between the various waves and petterns. So once you come out with the fibonacci projection (with the help of extensions and retracements via peak-trough analysis), it'll automatically point out towards the impending wave formation. So I don't ususally mark waves and predict moves, but usually try to project and understand price movement and amlitude of posibble movements and on basis of those determine the characters of the present wave (impulse/correctives)/cycle.
The best explanation can be found on these 2 books:
1)Fibonacci Applications and strategies for traders- Robert Fischer.
This book has tought me about the importance of the Fibonacci application in the price movement/Elliot wave rather than a simple wave count.
2)Mastering elliot waves-Glen Neely
Mukesh, Thanks to you for all your appreciation. I would like to tell from my own experience that market is nothing but a ratio of some irrational and rational parameters. Varios studies are there to differentiate those to factors to get the most out of the market. and I choose Technical analysis which deals with Price, Time, Volume. A better understanding of these 3 aspects can deliver you good to understand market dynamics. But I would suggest you to start from the scratch if you considering this seriously rather than going for Elliot and other stuffs directly(told because I posted a view above on Elliot, generally advanced stuffs attracts people and make then left in a cofused state). wold refer you two books initially;
ReplyDelete1)Technical analysis of financial market-John Murphy.
2)technical analysis of stocks trend: Edwards & Magee.
i feel Admin also got his answer. :). If there are more queries, please shoot.
ReplyDeleteThanks Satyam, that was a great explanation :) I use fibo extensively but not much into EW. Thanks for the books references.
ReplyDeleteThe elaborated expanation of garltley, Wolfe on charts shows your firm grip on fibonacci. For analysis of NIFTY you can study the books I referred and back test to analysze charts on the basis of fibocaaci applications. It'll be fascinating experience.
ReplyDelete